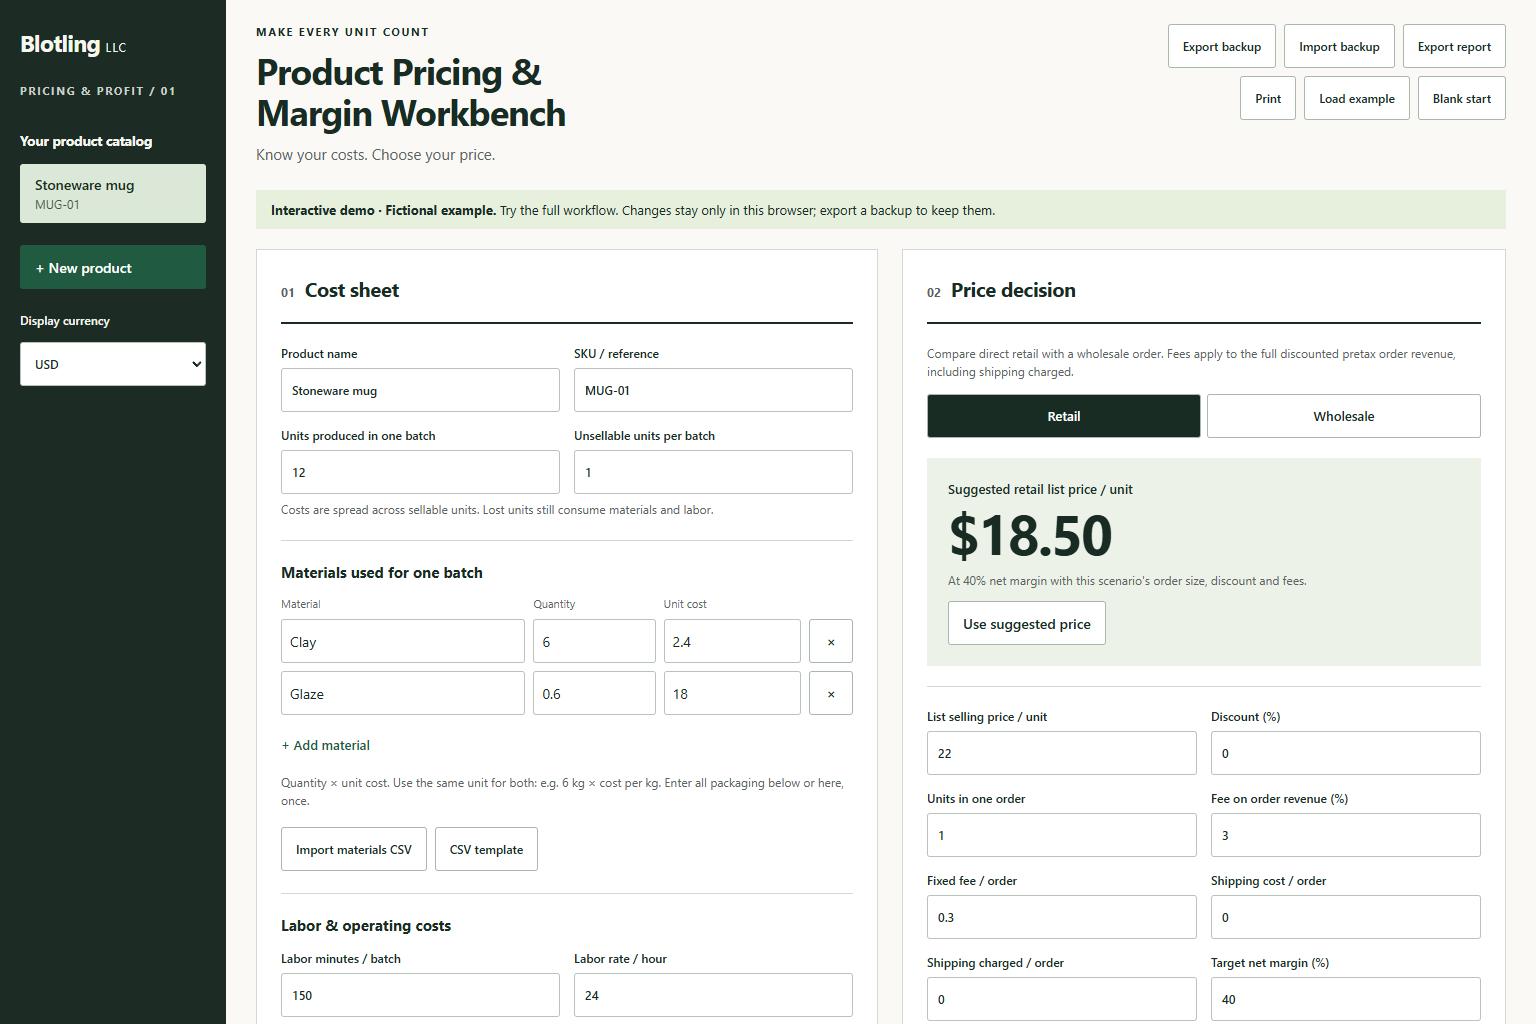
Compare retail and wholesale pricing with the costs that matter. Explore the example and check compatibility below.
Actual interface / Fictional sample data
What's included.
01
A saved product catalog
Keep products, materials, labor, overhead and packaging together.
02
Retail and wholesale scenarios
Compare order sizes, discounts, shipping charged and shipping cost.
03
Explicit fee assumptions
Enter one combined percentage on pretax order revenue, plus a fixed fee.
04
Target-price calculation
Choose a net-margin target and rounding increment; unsupported combinations are flagged.
05
Portable records
Export the comparison as CSV, print it, and retain full JSON workspace backups.
A practical workflow.
01
Cost the sellable batch
Enter produced and lost units, material quantities, labor time, overhead and per-unit packaging.
02
Set the order assumptions
Compare retail with wholesale using your own fees, discount, shipping and order size.
03
Review and preserve the comparison
Check the target suggestion against the actual scenario, then export a report and a separate JSON backup.
A fictional stoneware batch
The sample makes 12 mugs with one unsellable unit. Materials of $25.20, labor of $60 and overhead of $12 are spread across 11 sellable mugs. Adding $1.25 packaging gives about $10.09 production cost per sellable mug, before the order's shipping and fees. These are example inputs, not recommended costs or prices.
Fictional worked example. Check the assumptions and boundaries against your own records.
Before you buy.
REQUIREMENTS
Extract the ZIP and open tool.html in a current desktop browser. No account, installation or runtime internet connection is required. Chromium desktop and mobile viewport layouts were tested; extended data entry is best on desktop. This is a browser app, not an Excel or Google Sheets workbook.
KNOW THE SCOPE
One currency label; no conversion. The percentage fee uses one shared pretax revenue base including shipping charged. Mixed fee bases, tiered platform fees, taxes, returns and accounting integrations are outside scope. Fee rates are your inputs, not maintained platform data. Results depend on the costs you enter.